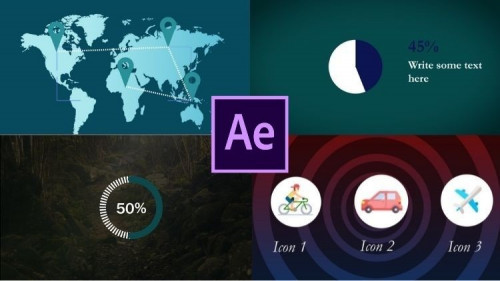
Udemy – Adobe After Effects – Infographics & data visualization
English | Tutorial | Size: 923.4MB
Learn how to use Adobe after effects To Create infographics & data visualization
Hi there my name is Nshuti Paulin and I’m motion graphics designer welcome in this infographics & data visualization in after effects course the course that will teach you how to create infographics animation from scratch in after effects
This course is for beginners. You don’t need any previous knowledge in VFX Compositing or any motion graphics experience in after effects . We’ll start with the super basics, taking simple icons breathing life into to them with After Effects.
i will work you through all the steps to create infographics animation in after effects from animating icons with text animation , creating beautiful and gradient background in after effects , creating animated background in after effects , creating animated world map in after effects , where to find free music and sound for your project, where to download free icons and graphics for infographics in after effects
this what we will learn in this Adobe after effects :
Creating project for infographics projects in after effects
how to add Background on your composition in after effects
where to get free icons
Animating Icon in after effects
Motion Bluer in after effects and easy easy
Overshoot animation in after effects
Animating Text in After effects
Adding pop and whoosh sound in your animation in after effects
How to create time line animation in after effects
How To create Gradient background in after effects
How to create seamless Background in after effects
adding infographics on animated background in after effects
Piechart in after effects
How to create Animated world map in after effects
Rendering in render queue
Rendering in adobe media encorder
Creating animated gif
Know that I will be around to help – if you get lost you can drop a post on the video ‘Questions and Answers’ below each video and I’ll be sure to get back to you.
What are you waiting for? Enroll Now!
Create Animated infographics: line Graphs, Bar Charts and Pie Charts in after effects
Use special effects and presets to create graphs in after effects
Understand and Use expressions to help create charts in after effects
Apply pro techniques to change graph values in after effects

RAPIDGATOR
rapidgator.net/file/6496c27b7d0473b71837bddc6bca486d/Udemy_-_Adobe_After_Effects_-_Infographics_&_data_visualization.part1.rar.html
rapidgator.net/file/4d1c408cd5ff4010d9e69f83f1edb8d0/Udemy_-_Adobe_After_Effects_-_Infographics_&_data_visualization.part2.rar.html
NITROFLARE
nitroflare.com/view/53D1FA187FC7856/Udemy_-_Adobe_After_Effects_-_Infographics_%26_data_visualization.part1.rar
nitroflare.com/view/A3D2EA676130CA1/Udemy_-_Adobe_After_Effects_-_Infographics_%26_data_visualization.part2.rar