PluralSight – Build Your First Data Visualization with NVD3

PluralSight – Build Your First Data Visualization with NVD3 Bookware-KNiSO
English | Size: 189.51 MB
Category: Tutorial


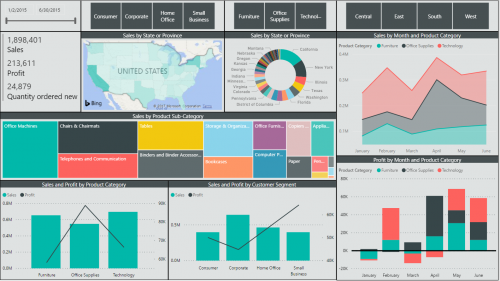
This course will teach you how to use NVD3 to build reusable charts and chart components for d3.js without taking away the power that d3.js gives you as well as visualize different datasets on your web applications

Udemy – Exterior Visualization with Blender 2.9 – From Beginner to Pro

Udemy – Exterior Visualization with Blender 2.9 – From Beginner to Pro
English | Size: 1.7GB
Category: Tutorial


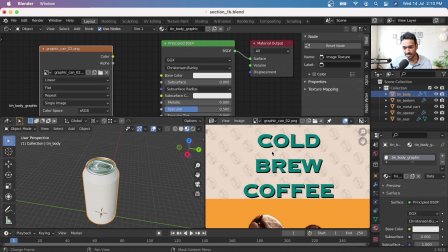
This course covers in a very simple way how to make architectural visualization masterpieces with the blender software. You will learn to design Different scenes from scratch. This course has been designed to help anyone who has little knowledge of the Blender Software or is perhaps anyone who wants to improve their existing 3d design skills

Data Camp – Introduction to Data Visualization with Seaborn

Data Camp – Introduction to Data Visualization with Seaborn
English | Size: 202.15 MB
Category: Programming


Seaborn is a powerful Python library that makes it easy to create informative and attractive visualizations. This course provides an introduction to Seaborn and teaches you how to visualize your data using plots such as scatter plots, box plots, and bar plots. You’ll do this while exploring survey responses about student hobbies and the factors that are associated with academic success. You’ll also learn about some of Seaborn’s advantages as a statistical visualization tool, such as how it automatically calculates confidence intervals. By the end of the course, you will be able to use Seaborn in a variety of situations to explore your data and effectively communicate the results of your data analyses to others.

Data Camp – Intermediate Data Visualization with Seaborn

Data Camp – Intermediate Data Visualization with Seaborn
English | Size: 188.88 MB
Category: Programming


Do you want to make beautiful, informative visualizations with ease? If so, then you must learn seaborn! Seaborn is a visualization library that is an essential part of the python data science toolkit. In this course, you will learn how to use seaborn’s sophisticated visualization tools to analyze multiple real world datasets including the American Housing Survey, college tuition data, and guests from the popular television series, The Daily Show. Following this course, you will be able to use seaborn functions to visualize your data in several different formats and customize seaborn plots for your unique needs.